

From Silicon Valley to São Paulo: How Customer Behavior Dictates the $1 Trillion Global Ad Spend, and how to decode Customer Behavior

A warm welcome to the new readers who joined us over last month!
In this newsletter, we will zoom out and do a whirlwind tour of global advertising from Silicon Valley to São Paulo. Buckle up as we dissect the trillion-dollar ad industry. We'll unpack how culture shapes spending and why your grandparents’ favorite telenovela might be worth more than a million clicks. Finally, we will discuss how to merge the data and anecdotes to decode the complex customer behavior

A) Global Ad Spend and Contributors
Here’s the kicker – Global ad spend contributed nearly $1 trillion, or 1% of the world’s GDP, in 2023, powered by the rapid growth of digital media, adding $40 billion annually.
Global ad spending has been on an upward trajectory growing nearly 10% every year over past few years, reaching nearly $900 billion in 2023. Digital advertising is the undisputed champion, capturing 62% of total ad spend in 2023. The digital ad market is expanding at a blistering pace, outpacing overall ad growth.
Each year, an additional $40 billion is poured into digital advertising, and widening the gap between digital and traditional ad spend is widening.
Key Contributors of Growth
Expected factors: The digital landscape expanded in tandem with economic prosperity, as rising internet adoption and GDP growth steadily fueled progress
Surprise factor: Inflation emerged as an unexpected catalyst, contributing 3%
Growth Decelerators
The only decelerator was Russia-Ukraine conflict that cast its shadow, causing a 3.3% decline. A lot of companies including juggernauts like Google paused the vast majority of our commercial activities in Russia – including ads on it’s properties and networks globally for all Russian-based advertisers.
Ad Spend Growth Waterfall is below (+/- 0.4% Margin of error)
Modified Graph - Data from Statistica
B) Regional Disparities driven by Customer Behaviors: A Tale of Two Worlds
Upon de-aggregating the data, there are stark regional differences in how the spend gets split between various channels, activities, and actors within the ecosystem driven by consumer behavior of the region.
Let's explore an extreme examples the United States and Latin America (LATAM).
United States vs. LATAM: A Digital Divide
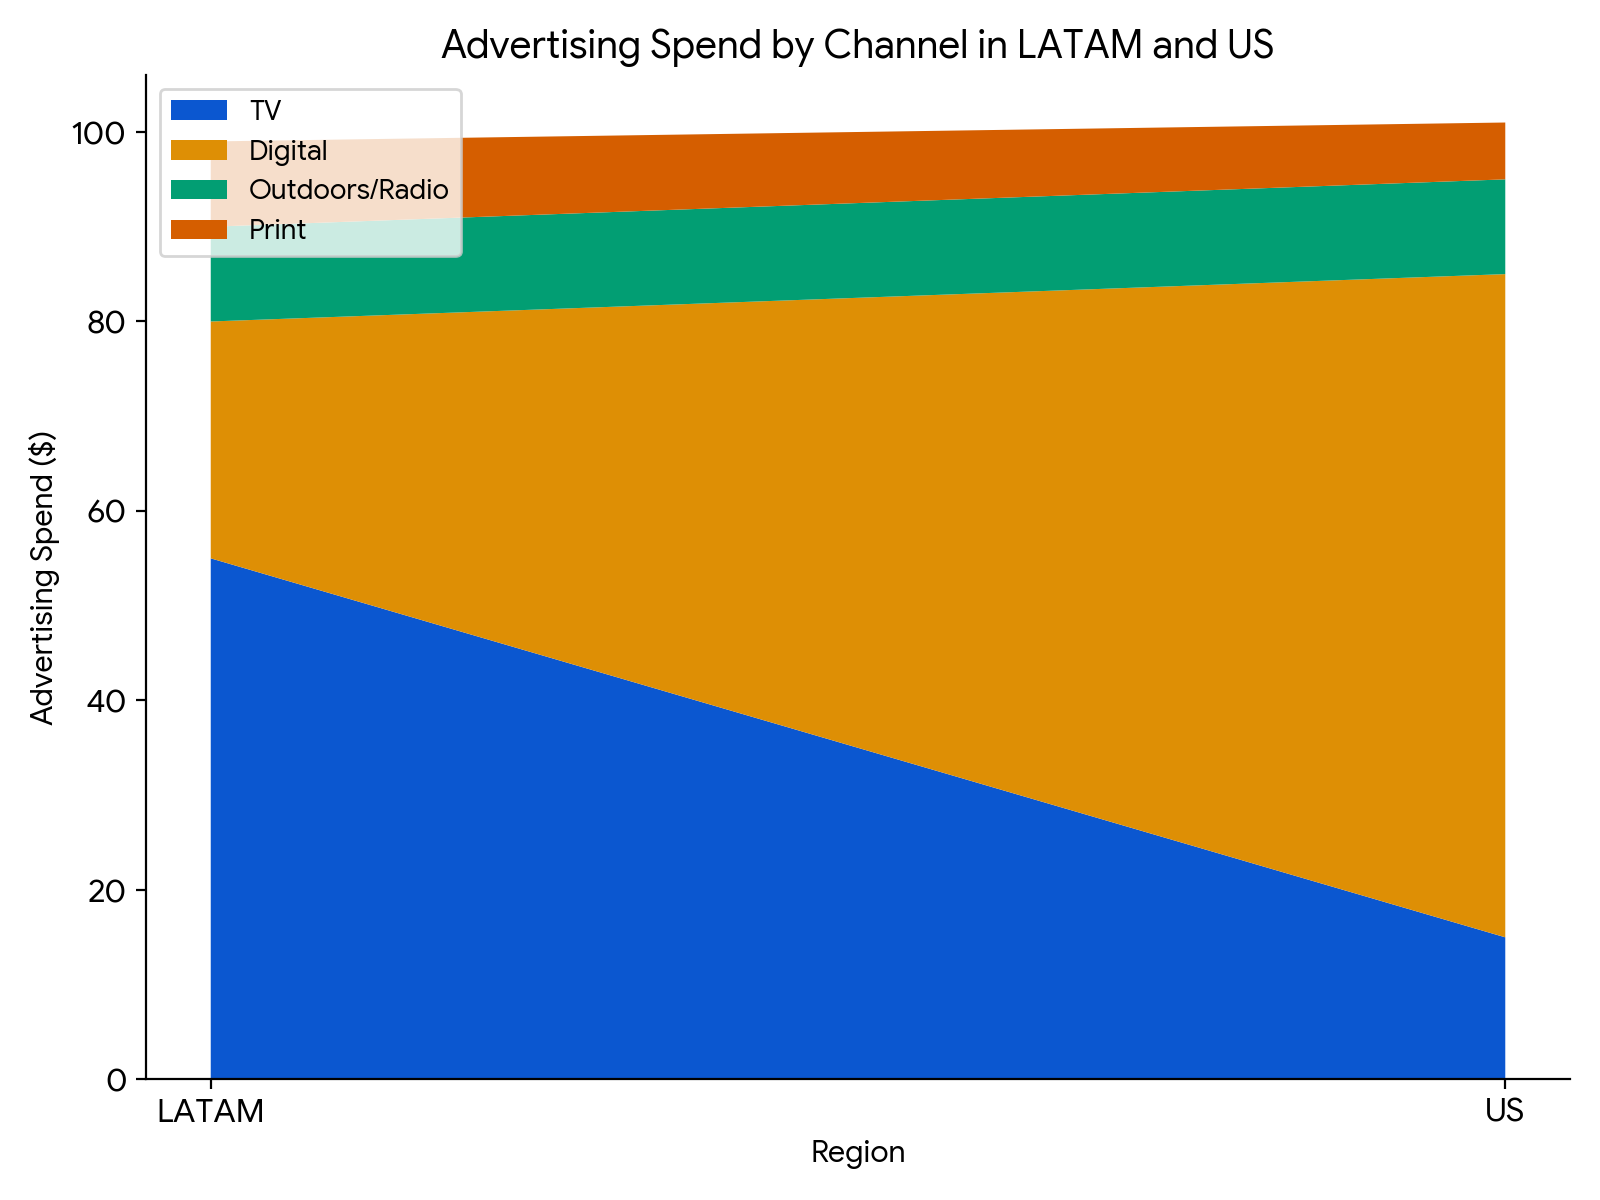
TV and Digital spends are inverted between US and LATAM with LATAM heavily skewed towards traditional channels
LATAM: TV - 55%    Digital - 25%
 US:            TV - 15%  Digital - 70%
For every $100 spend in Ads, below is the channel split
The advertising chasm between Latin America and the United States is rooted in distinct consumer behaviors, shaped by socioeconomic factors and technological advancements. Let's delve deeper into the LATAM consumer psyche:
Let’s take a deeper dive into various aspects of consumer behavior in LATAM
- Culture -TV Time is Family Time: Television remains a dominant medium because it is a shared family activity, deeply ingrained in daily life, and offers a wide range of local and international content that appeals to diverse audiences. The popularity of telenovelas, sports, and news programs on TV ensures high viewer engagement and broad reach, making it an attractive channel for advertisers
- Socioeconomic factors : Economic disparities across the region contribute to lower digital penetration. High costs associated with internet access and digital devices make it difficult for lower-income populations to fully participate in the digital ecosystem. Consequently, a significant portion of the population remains reliant on traditional media like TV and radio, which are more accessible and affordable
- Infrastructure Challenges : Infrastructure challenges play a significant role; many areas, especially rural regions, lack the necessary high-speed internet connectivity. Radio plays a crucial role, especially in areas where internet connectivity is sparse. It serves as a vital source of news, music, and community updates, reinforcing its importance in daily routines. The strong connection to local culture and the ability to reach audiences during commutes or work further boost radio's relevance
These customer behavior in LATAM shaped by culture, socio economic factors and infrastructure maturity sustain the dominance of traditional media and reduce the urgency for advertisers to shift their focus entirely to digital platforms.
C) Global Ad Spend Clusters driven Customer Preferences: A Broader Perspective
As we zoom out, we can identify distinct clusters in global ad spend patterns:

Cluster 1: Digital Dominance in Developed Western Markets
Countries: United States, United Kingdom, Australia
How Customer Behaviors influence spend:
Higher expectations that only digital can deliver: In these markets, consumers are deeply entrenched in digital ecosystems. The majority of daily activities—from shopping and entertainment to social interactions—take place online. High smartphone penetration and widespread use of social media platforms drive advertisers to allocate over 70% of their budgets to digital channels. Consumers in these regions expect personalized, instant, and interactive experiences, which digital advertising can effectively deliver.
Increasing prevalence of on-demand content: The preference for on-demand content, like streaming services and social media, over traditional TV or print, further pushes ad spend towards digital. Brands are also capitalizing on advanced data analytics to target consumers with precision, tailoring ads to individual preferences and behaviors.
Cluster 2: Balanced Media Mix in Mature European Markets
Countries: Germany, France, Japan (recent shift)
How Customer Behaviors influence spend:
Older demographics: In these regions, while digital engagement is significant, traditional media still plays a crucial role due to the diverse demographic spread. Older generations, who might prefer TV, print, or radio, make up a substantial portion of the audience, leading to a more balanced media spend.
Cultural preferences: Cultural beliefs play a role; for instance, print media in these countries is often seen as more trustworthy and credible, influencing advertisers to maintain a presence in these channels. The recent increase in digital spend in Japan, for example, reflects a growing trend among younger consumers who are shifting towards digital platforms. However, the strong tradition of TV and other media means brands continue to invest across multiple channels to ensure comprehensive reach.
Cluster 3: Emerging Markets with Resilient Traditional Media
Countries: Brazil (representative of LATAM)
Customer Behavior Influence:
As discussed earlier in this article, traditional media like TV and radio remain highly influential due to cultural norms and the slower pace of digital adoption. TV, in particular, is a dominant source of entertainment and news, especially in regions where internet access may be less reliable or widespread.
As we move forward, the key to unlocking advertising potential worldwide will be in striking the right balance between embracing digital innovation and respecting traditional media's enduring influence in certain markets. The global advertising landscape is not a one-size-fits-all arena, but a rich interplay of diverse consumer behaviors waiting to be understood and leveraged.
D) How to blend the Art and Science of Customer behavior: Example : Pew Research on Social Media
Anecdotes and qualitative narratives are crucial when it comes to understand customer behaviors since there there are intangibles that data doesn’t always capture. However, they should always be used in conjunction with behavioral data to understand the full story.
But what if the general anecdotes goes against behavioral data. When that happens, it’s time to do a deeper dive - Evaluate biases, time lags and consider small-scale experiments
Evaluate data collection methods. Look for potential biases in both the data collection and the sources of anecdotes.
Time lag- Sometimes, anecdotes might be picking up on emerging trends that haven't yet manifested in large-scale behavioral data.
Consider running small-scale experiments or A/B tests to validate or refute the anecdotal evidence.
Curious Case of Facebook & Pew Research Center
If you ask some of the younger demographics if they use Facebook, you will hear some version of “Facebook is for relatively older people.” When I looked at the split of US demographic across social media platforms published by Pew Research Center(pasted at the end of this article), I see a different story, at least from a data standpoint
In fact, Facebook is more popular (67%) than TikTok (62%) among the 18-29 age group…
So why the discrepancy ?
Maybe the trends aren’t showing up in the data just yet, or maybe there is a data/anecdote collection bias explaining why anecdotes don’t line with the behavioral data.
This case powerfully illustrates why blending qualitative and quantitative insights is crucial. Without this holistic approach, we risk misinterpreting customer behavior, potentially leading to wasted ad spend and missed business opportunities. By blending data with human stories, we unlock a deeper understanding of Customer behavior that guides marketing spend and ROI
Pew Research below

FREE- Subscribe for free to receive quality post once a month